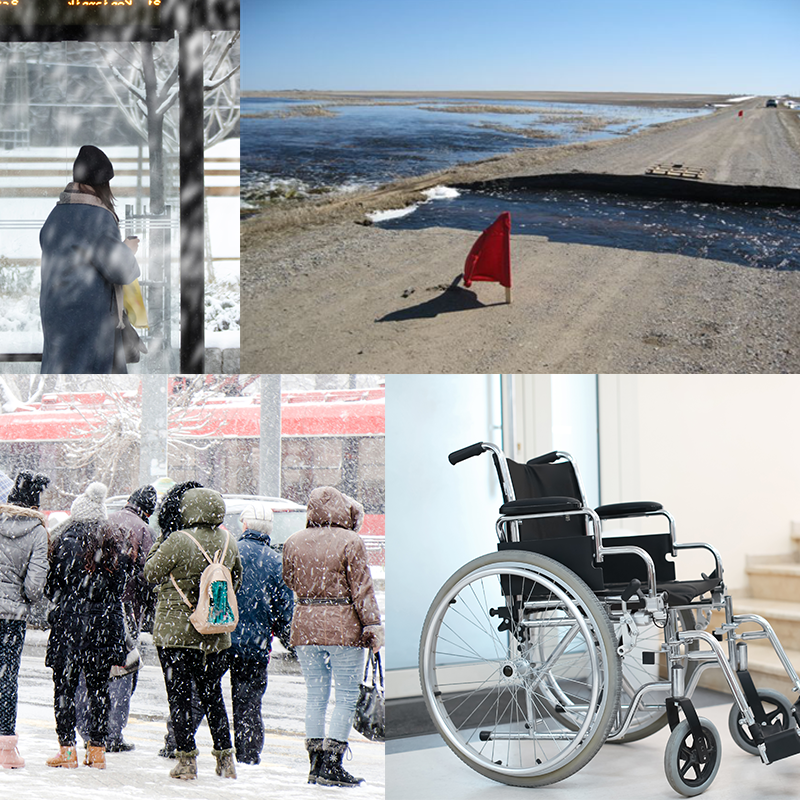
Vulnerabilities may affect an individual's or family's ability to prepare, response, and recovery from a disaster event. Each community has unique characteristics and areas of risk, some examples include:
- High Poverty
- Limited access to transportation
- Age (young or old)
- Limited English Language Skills
- Disability Status
Understanding where vulnerability may be concentrated in intersection with areas of risk allows for emergency management professionals to plan comprehensively.
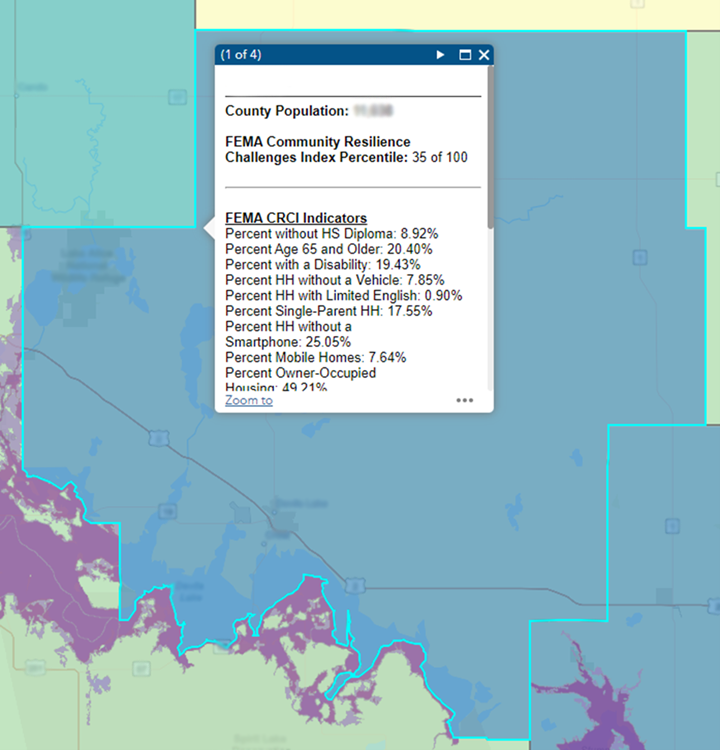
There are several tools that can be utilized that differ in focus to include socioeconomic, public health and environmental quality, and access to critical infrastructure such as hospitals or reliable broadband. Geographic information systems (GIS) provide a foundation of information for planners to be supplemented by local knowledge and outreach findings. The resources below provide a start to conducting a community risk assessment.
Mapping Tools
A rural capacity map - Headwaters Economics
Centers for Disease Control and Prevention (CDC) Social Vulnerability Index (SVI): SVI Interactive Map (cdc.gov)
Centers for Disease Control and Prevention (CDC) Environmental Justice Index (EJI) Explorer: EJI Explorer (cdc.gov)
Resilience Analysis and Planning Tool (RAPT): Resilience Analysis and Planning Tool (RAPT) | FEMA.gov
While these are a few resources, there is a myriad of interactive GIS tools that exist to support communities to reach equitable outcomes. While census data is regularly updated, other data-based tools may come from a variety of organizations and sources. We encourage you to cross-reference multiple sources to avoid making damaging generalities in emergency plans. It is best to use one’s educated judgement when reaching conclusions.
Emergency management professionals explore these topics and consider these planning aspects with the intent of bettering communities and increasing wholistic resilience.